Mapping data and checking facts

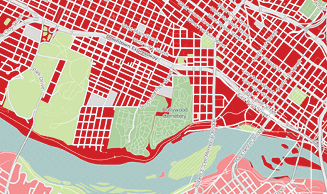
Electronic mapping resources are fast becoming an important tool for researchers to visually communicate their scholarship. More and more VCU research projects  require the visualization of data to supplement academic efforts in effective and powerful ways. For example, while you can explain the concept of food deserts, having a way to visually show the large geographic areas that do not have access to a grocery store, paints a much more graphic reality. Or, when a nonprofit needs a list of zip codes that meet a certain criteria for potential donors, looking at that data on an interactive map, enables you to change the data and make adjustments to better focus on exactly the areas you need to cover.
VCU Libraries has several mapping resources for a range of skill levels:
- SimplyMap allows you to create thematic maps and reports using extensive demographic, business and marketing data. SimplyMap has all the data you need to answer key research questions, make sound business decisions and understand the socio-demographic and economic conditions of any geographic area in the United States. It offers more than 75,000 data variables related to demographics, employment, housing, market segments, businesses, consumer spending, brand preferences and public health. Find It
- VCU Libraries owns many spatial and numeric data sets, most of which are produced by the Federal government. Use the VCU Libraries Search to search the collection, or browse a list of data collections. Find It
by Business and Public Affairs Collections Librarian Patricia Sobczak
Categories Data