Dive into Infographics with Adobe

LEDStudio Media Specialist, Melanie Felix and Graphic Designer, Erin Christoph help us dive into engaging content with infographics.
Educators can create interesting and appealing infographics that facilitate learning with Adobe software. Infographics are an engaging way to communicate complex or dense information to students or general audiences. They can be used for a multitude of different content.
Examples of Types of Infographics
- Information (instructions, tips, etc)
- Lists
- Timelines
- Comparisons
- Maps
- Statistics
- Flowcharts
- Hierarchies
- Flowcharts
- Anatomical
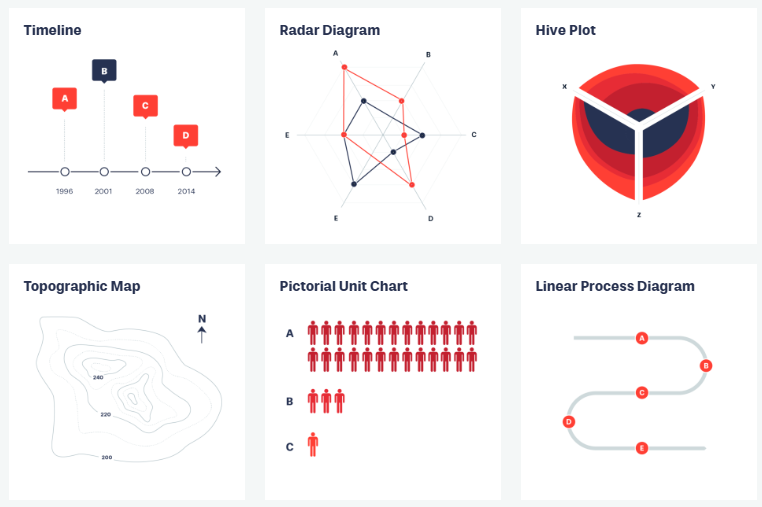
Check out: https://datavizproject.com/ for awesome ideas! Images from Data Viz Project are copyright Ferdio and available under a Creative Commons Attribution – Non Commercial – No Derivatives 4.0 International license.
Adobe Software for Creating Infographics
Illustrator is ideal for creating vector-based graphics. It gives you full control over font, shape, line, and color, so any infographic that uses illustrative elements is best suited for Illustrator.
InDesign is best for creating layout-heavy designs that involve large amounts of text, such as brochures, reports, or multi-page documents. If you need to structure your infographic like a mini-document with paragraphs of text and complex grids, InDesign is the better choice.
Adobe Express is a design tool that doesn’t require any advanced graphic design experience or skills. It’s a free application that allows you to quickly create visually appealing infographics for presentations, social media, reports, and marketing materials. Adobe programs are very powerful for creatives but making your own infographics doesn’t have to be daunting. Adobe Express comes complete with templates, color palettes, and professional typefaces built right in. Ready-made designs can be customized easily. Express allows you to import imagery but also includes a large library of icons and assets and additionally, has its own AI-image generator.
Data and Design Made Easy with Adobe Express
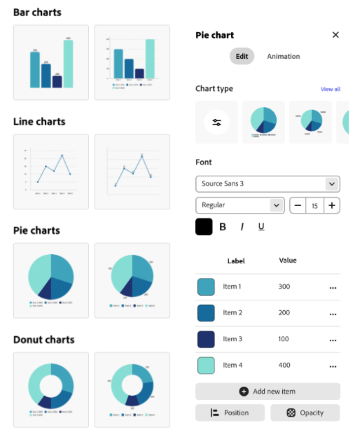
One of the best features within Adobe Express is the ability to create and customize beautiful charts and grids with the click of a button. You can make Bar charts, Line charts, Pie charts, and more! Easily customize them with your own data and colors.
Since Adobe Express is free and easy to use, you can use it for classroom projects by challenging students to create their own infographics. For example, students can create infographics that summarize the key findings of a research paper, book, or article, as a practice in distilling complex information into visual representations. Another idea would be to create a historical timeline, including dates, visuals, and short descriptions.
Adobe Education Institute Opportunity

The LEDstudio Media Team was able to learn all about the new and exciting features of Adobe Express through sessions with the Adobe Education Institute. This virtual conference had sessions on teaching with generative ai, podcasting, storytelling with video, and much more.
Adobe Education Institute 2025 will be June 9-13. Check out the previous LEDstudio blog post for more details on this event and a full list of upcoming professional development opportunities with Adobe.
Tips for Designing Infographics
- A consistent visual style is essential for your infographic to look professional and cohesive. Make sure to choose legible fonts, and that your graphics are simple and clear so that they don’t overcomplicate your message.
- Using a visual hierarchy will help with the organization of your infographic. Divide your infographic into sections by using spacing and headers, and make sure the most important information is the most readable.
- To ensure your infographic meets accessibility standards, use high contrast colors, provide text alternatives, and use readable fonts.
Examples of Infographics Made by the LEDStudio Media Team