Automatic Simplification: Conversion from Visual to Tactile Graphics
Practitioners | Researchers | Source materials
For Practitioners
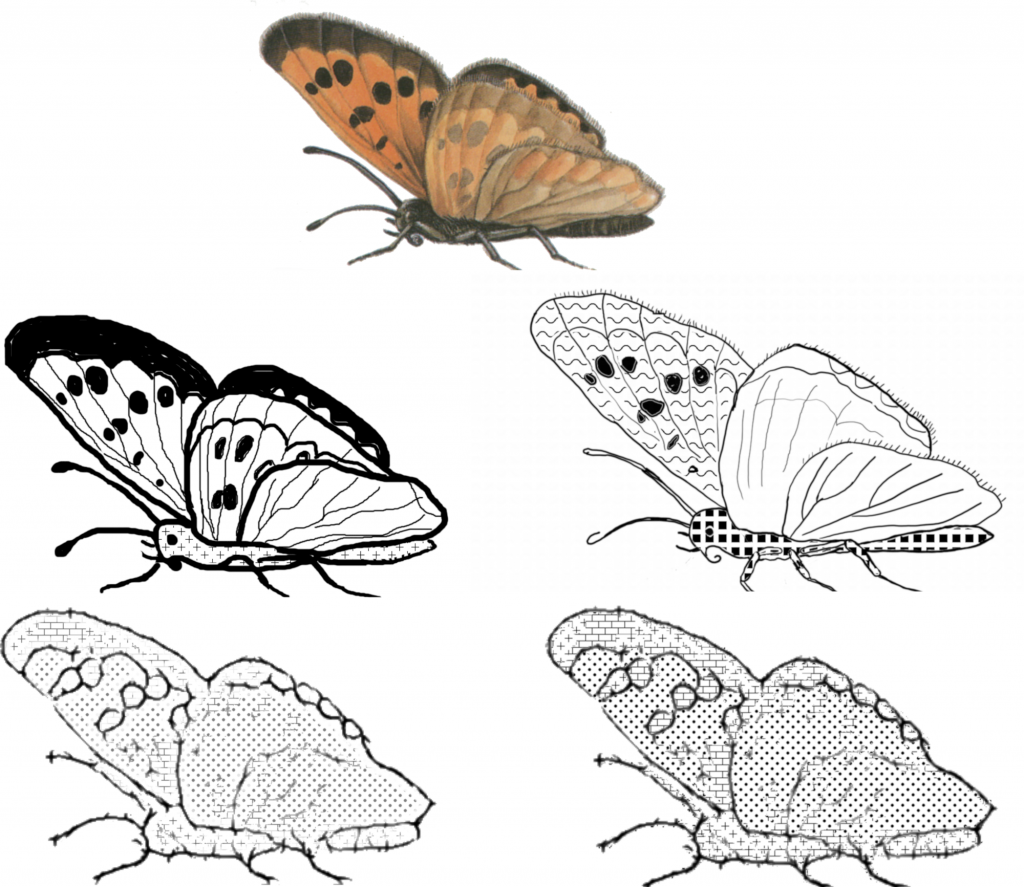
Many books, web tutorials, and teaching courses exist to help train teachers for individuals who are visually impaired (TVIs) how to develop tactile graphics. These sources teach methods ranging in their development methods from the use of craft supplies, to image manipulation software. More teachers are looking towards technology in order to produce consistent results and to reduce the time it takes to make tactile graphics. This project began with observing professionals converting graphics to tactile diagrams in order to model an automated system after their work. Working with the professionals led to a procedure for using image manipulation software in order to develop tactile graphics with textures (view workshop on making tactile graphics with image processing software). The professionals, using this procedure, converted a set of images to tactile graphics allowing for a basis of comparison for further work. Though the resulting images often look similar there are naturally small visual differences that may be perceived tactically as wide variations.
Current commercially available software attempts to allow users to develop their own tactile graphics but often requires that the image author make the graphs manually. The top 3 commercially available applications include: Firebird Graphics Editor by Enabling Technologies, TactileView by Irie AT, and QuickTac by Duxbury Systems. Each of these allow the user to manually draw and edit diagrams and to export to a braille embosser. Only TactileView allows the user to export to micro capsule paper however it is limited to importing vector images which are specialized to diagrams and not intended for natural images. Only Firebird Graphics Editor allows arbitrary images to be imported while attempting to convert the images automatically. Firebird Graphics Editor by default uses a 2 segment clustering method to convert the graphic but also supports edge detection. When the software separates foreground and background it arbitrarily adds its default texture to one of them but does not leave an outline between regions (as recommended by TVIs). FireBird Graphics Editor is also the only editor that allows the image author to use predefined textures to help distinguish regions. None of the commercially available application do an adequate job of converting the graphics for a wide range of uses nor do they have enough options or features for most uses, such as: import arbitrary images, outline important components, multiple textures for regions of interest, and the inclusion of ancillary lines to accentuate structures of interest. They also do not attempt to simplify the diagram.

For Researchers
Segmentation
Segmentation is the process of splitting an image into its constituent components or segments. A segment does not necessarily have to be a contiguous area it can be broken into closed bounded regions separated by some distance. Segments are one or more regions that schematically relate between and within the area of the region(s) in some context. For example the American flag may be split so that each star and each stripe are split into individual regions but all the red strips are grouped into one segment, all the white stripes are grouped into one segment, and all the stars are one segment.
Though past researchers considered edge detection and segmentation this was re-visited to determine if newer methods could be applied. One focus of this project was to model the algorithm after the way professionals see and process tactile diagrams. To that end a segmentation model is needed to account for the initial steps taken by professional diagram makers.
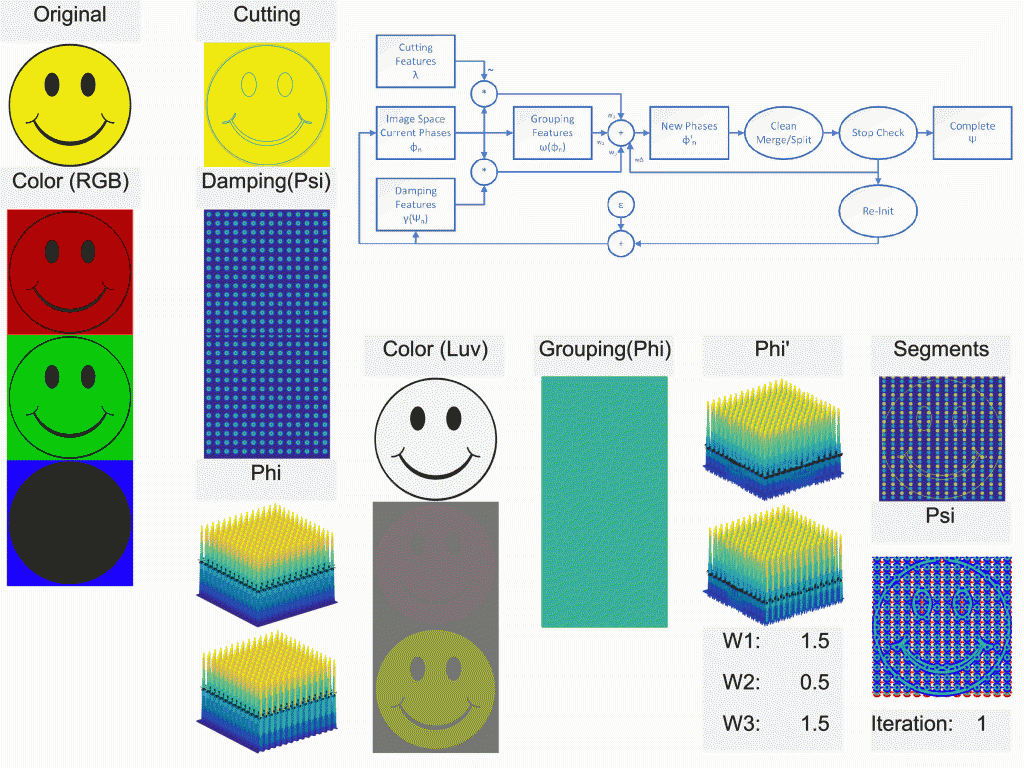
Several base segmentation algorithms along with their constituent components and a wide range of features were explored. Our intent for segmentation was not traditional visual segmentation but segmentation for the conversion of images to tactile diagrams. The current state of segmentation algorithms are optimized for traditional visual segmentation. Appropriate improvements to the k-means algorithm and extensive improvements to the level set algorithm were undertaken to develop a segmentation model that would work like professional diagram makers. Next the algorithm improvements were extensively tested in an objective manor to optimize the algorithms for automatic conversion of visual images to tactile graphics. Improvements included expansion to new feature spaces, exploration of newer feature space measurements, and alterations to the governing equations.

Unlike other user tests, we developed a testing strategy that incorporated testing computer generate graphics against professionally made graphics. This allowed us to accurately determine if the generated graphics were able to convey the required information to understand the graphics with similar performance as professionally made diagrams. Our testing method, intentionally stress tests diagram performance by having users describe the diagrams without text labels nor teacher assistance to mimic their independent use. The protocol also assessed both objective measures such as performance with subjective measures of usability. Our developed level set method performed about 75% of professionally made diagram performance and the gPb-owt-ucm performed about 55% of professional diagrams.
Simplification
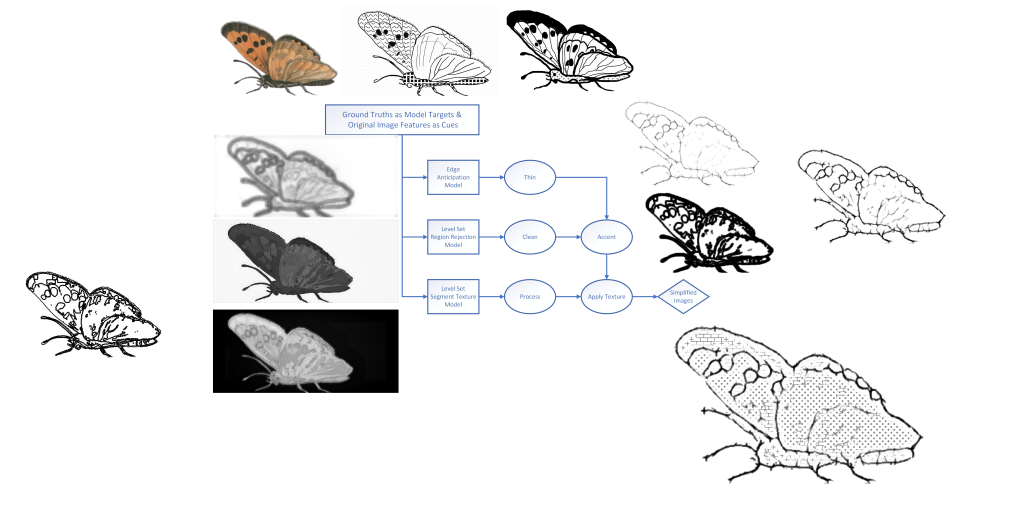
Segmentation alone is not sufficient to produce tactile graphics similar to those created by experienced TVIs. TVIs first segment images mentally; however, they then decide which segments to remove from the picture and which to outline based on the importance and relevance of those segments to the content of the whole image. They often leave off many smaller regions that do not help interpret the image but will increase the cognitive burden for users when exploring the images: tactile perception of an image, even for basic pictures, already has a high mental demand which needs to be minimized as much as possible. Once the TVIs have outlined the relevant segments and regions, they add those ancillary lines that further improve understanding and add critical details: again, avoiding adding unhelpful information that will only add to the users cognitive burden. Finally, texture is added to only those regions for which the added texture will aid in comprehension of the diagram.
Supervised machine learning is a great statistical technique for modeling systems, such as TVIs mental procedure for constructing tactile diagrams, where intrinsic information in a stimulus is used to predict the human response. Some advanced regression algorithms can handle hundreds of local and global information cues. This is of benefit for our purposes as how TVIs develop diagrams is a complex process that takes years for a TVI to become an expert. However, there have been limited studies of the decision-making process TVIs use to create these diagrams, and those studies have focused on simple mathematical graphs and charts. With the lack of any knowledge to narrow the exploration of the feature space that could be used in modeling photographs and diagrams, there are a significant number of cues that could reasonably be thought to contribute to the tactile diagram construction process.
We developed models of the major steps professionals take to illustrate tactile graphics. From our model, we developed an algorithm for the automatic creation and simplification of tactile graphics. The model included the key steps professionals take to outline lines, segment images, clean unnecessary regions, and apply textures to segments. TVIs tend to make iterative changes to diagrams then inspect their diagrams and continue to make changes. Our model does not need to work iteratively and goes through the steps only once. Our model not only explored cues from local to global but also cues based in simple calculation to those requiring non linear processing and even Google image processing. Cues from all levels along with some quadratic and interactions terms were refined to a small set to improve run-time without losing accuracy.

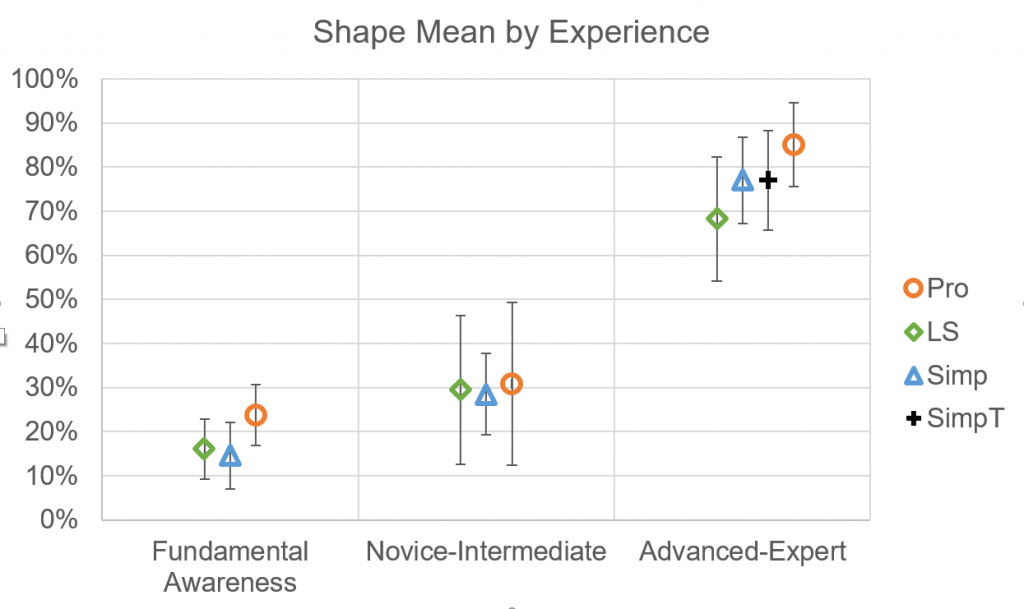
We have developed a testing protocol for comparing computer generated graphics to those made by professionals. Our algorithm for converting visual images to tactile diagrams with simplification achieved 90% of the accuracy of professionally made diagrams for people that used tactile graphics frequently. The difference in performance among methods was far out shadowed by much larger differences between experience levels. Many new tactile graphics users commented that they loved segmentation alone because it felt nice where as the expert users commented they like the feel of segmentation alone but segmentation with simplification conveys information content much better. This is a considerable step towards improving access to tactile graphics for people who are blind or visually impaired. The process of conversion, without speed boosts that can be achieved outside of Matlab, and while extracting all cues explored not just those required by the model, takes an average 89 seconds for images averaging 1140×1500 pixels.

Source Materials
Dissertation: Download
Code: Download
Code synopsis: Download
Acknowledgements
This material is based upon work supported by the National Science Foundation under Grant Number 1218310. (Any opinions, findings, and conclusions or recommendations expressed in this material are those of the author(s) and do not necessarily reflect the views of the National Science Foundation.)