Integrity and Ethics, Community Engagement, and the VCU HRPP
As part of the VCU Human Research Protection Program’s (HRPP) commitment to continual improvement, we generate metrics to evaluate how well our program complies with regulations, engages the community, and upholds VCU’s core values.
View the infographic below to learn more about some facts and figures behind the VCU HRPP! Alt text for the infographic follows the image.
Infographic Alt Text
Facts about the VCU HRPP
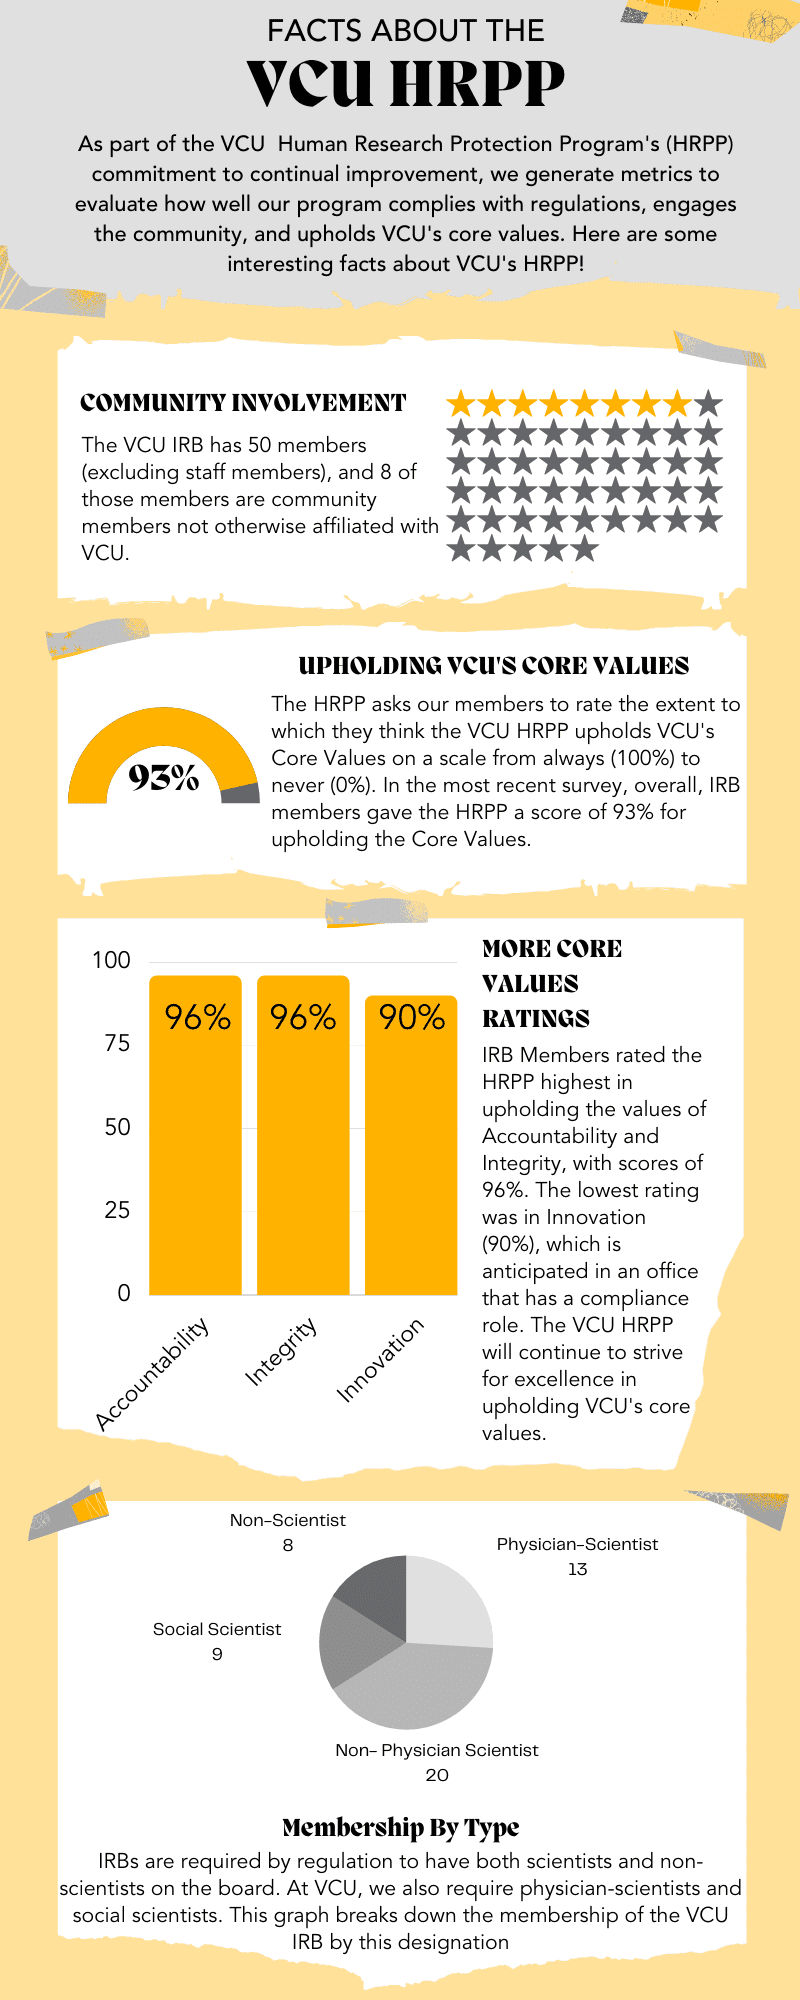
As part of the VCU Human Research Protection Program’s (HRPP) commitment to continual improvement, we generate metrics to evaluate how well our program complies with regulations, engages the community, and upholds VCU’s core values. Here are some interesting facts about VCU’s HRPP!
Community Involvement
The VCU IRB has 50 members (excluding staff members), and 8 of those members are community members not otherwise affiliated with VCU.
[Image Description: A bank of star shapes, 8 of which are gold colored, and 42 of which are gray colored, representing the 8 community members on the VCU IRB, among the 42 affiliated members]
Upholding VCU’s Core Values
The HRPP asks our members to rate the extent to which they think the VCU HRPP upholds VCU’s Core Values on a scale from always (100%) to never (0%). In the most recent survey, overall, IRB members gave the HRPP a score of 93% for upholding the Core Values.
More Core Values Ratings
IRB Members rated the HRPP highest in upholding the values of Accountability and Integrity, with scores of 96%. The lowest rating was in Innovation (90%), which is anticipated in an office that has a compliance role. The VCU HRPP will continue to strive for excellence in upholding VCU’s core values.
[Image Description: a bar graph representing the data presented in text above]
Membership By Type
IRBs are required by regulation to have both scientists and non-scientists on the board. At VCU, we also require physician-scientists and social scientists. This graph breaks down the membership of the VCU IRB by this designation.
[Image description: a pie graph representing the distribution of IRB membership by type. The graph indicates there are 13 physician-scientists, 20 non-physician scientists, 9 social scientists, and 8 non-scientists.]
Categories Announcements and Updates